Why do teams report different numbers?
Start by comparing metric grain, source authority, time windows, exclusions, and ownership. A shared dashboard cannot fix conflicting definitions.
TRAVINTO / DATA ARCHITECTURE
Enterprise data architecture connecting sources, business entities, history, quality, and reusable data products for analytics and AI.

THE DECISIONS BEHIND THE ARCHITECTURE
Start by comparing metric grain, source authority, time windows, exclusions, and ownership. A shared dashboard cannot fix conflicting definitions.
Begin with workload needs: freshness, concurrency, history, data shape, access, and operating capability. The architecture may use more than one serving pattern.
Accessible records are not enough. AI needs permission-aware context, reliable identities, useful metadata, source versions, quality evidence, and clear meaning.
WORK AREAS & TYPICAL DELIVERABLES
These are engagement directions; selected responsibilities and deliverables are agreed for the problem in hand.
Define conceptual entities, logical relationships, grain, keys, and the conditions under which a record or metric applies.
Typical output: A domain model, glossary, and decision log.
Define authoritative sources, refresh requirements, schema behavior, exception handling, and reconciliation across APIs, batch, CDC, events, and documents.
Typical output: Source contracts, interface boundaries, and ingestion decisions.
Plan raw evidence, validated records, curated products, effective dates, late changes, and business-approved transformations.
Typical output: Product contracts, history rules, and quality requirements.
Connect BI measures, applications, APIs, retrieval indexes, and model features to stable definitions and permitted use.
Typical output: A serving model, semantic definitions, and consumer acceptance criteria.
Map logical responsibilities to physical services with workload isolation, observability, recovery, lifecycle, and cost ownership.
Typical output: Target architecture, non-functional requirements, and operating responsibilities.
Track dependencies and source-to-target semantics; validate changes with representative records and business cases.
Typical output: A transition roadmap, mapping rules, and reconciliation evidence.
A CONNECTED REFERENCE VIEW
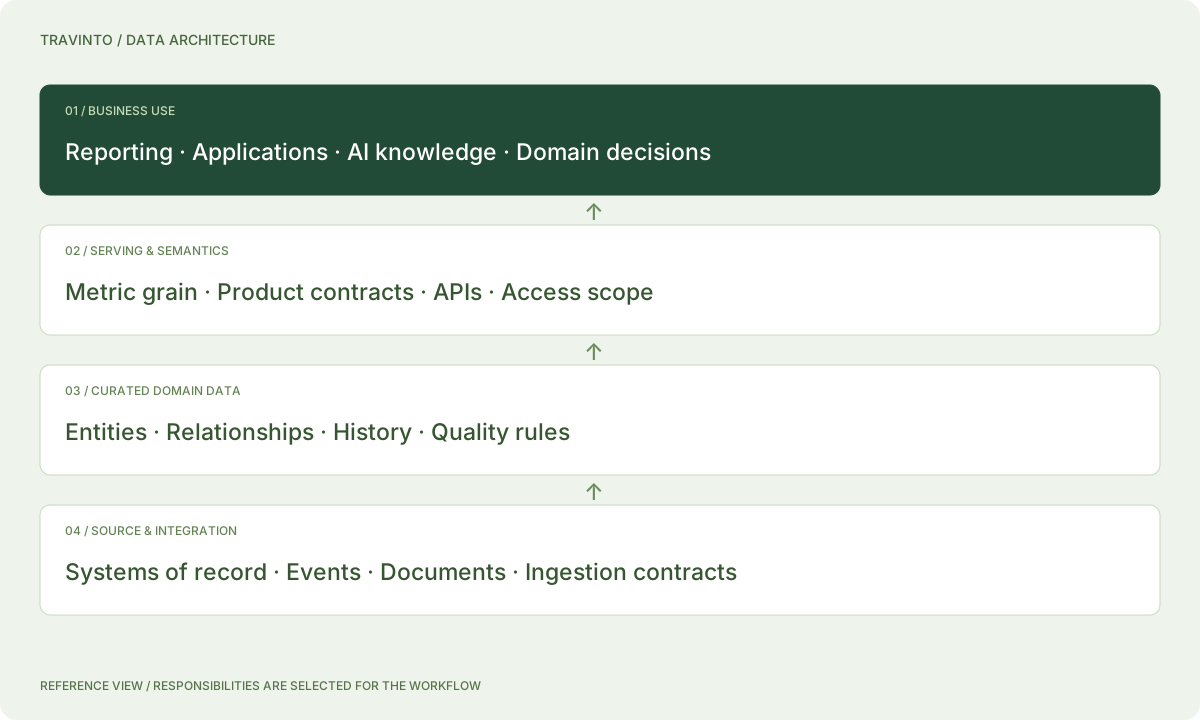
Reporting · Applications · AI knowledge · Domain decisions
Metric grain · Product contracts · APIs · Access scope
Entities · Relationships · History · Quality rules
Systems of record · Events · Documents · Ingestion contracts
Retail example / stock is not one number
A merchandising report, an online availability answer, and a warehouse view may use different stock states. Model on-hand, reserved, in-transit, and available-to-promise quantities with location, units, and event time. Then define which consumer can use each view.
Explore this industry ↗
WHAT A USEFUL ASSESSMENT CAN LEAVE BEHIND
Conceptual, logical & physical views
Source-to-consumer dependency map
Domain product & metric contracts
Quality, access & history rules
Target-state & transition roadmap
A USEFUL NEXT STEP
Bring a representative workflow, existing definitions or controls, permitted source examples, and the people who own the result.
Discuss your priorities ↗