Data. Intelligence. Possibility.
CareersContactsales@travinto.com
travinto.TECHNOLOGIES Let’s talk ↗

What are you looking for?

Start typing to explore Travinto.

TRAVINTO / X2X BI MIGRATOR

Modernize reporting.
Keep the decision consistent.

Modernize dashboards, enterprise reports, semantic models, and application reporting with a business-led migration plan. Combine deterministic mappings with agentic assistance, then validate metrics, filters, security, and delivery before acceptance.

t. / X2X BI MigratorWORKSPACE PREVIEW

RETAIL TRADING / SEMANTIC REVIEW

One metric.
Several acceptance questions.

BUSINESS MEASURENet sales
Grain
Product · channel · fiscal period
Definition
Agreed sales less approved returns
Owner
Trading domain reviewer
Metric mappingProposal prepared
Filter parityTests required
Role accessReview pending
Business sign-offNot yet accepted
Demonstration workspace · no live reports or data connections.

X2X BI MIGRATOR / REPORTING MODERNIZATION

Migrate the experience.
Preserve the decision.

Start from how people use the report, the definitions behind it, and the evidence needed to accept a replacement. Migration routes and target platforms are assessed for the selected estate.

Enterprise BI platform migration

BusinessObjects, Cognos or Oracle BI → a reviewed modern BI design

Assess universes, logical models, report queries, prompts, security, and delivery behavior. Target Power BI, Tableau, Looker, or another platform only after feature and version assessment.

Dashboard & self-service modernization

Power BI, Tableau, Qlik and cloud analytics estates

Review semantic dependencies, calculations, interactions, extracts, identity, and refresh. A workbook move and a platform change have different acceptance requirements.

Paginated & operational reporting

SSRS, Crystal, BI Publisher and embedded reports

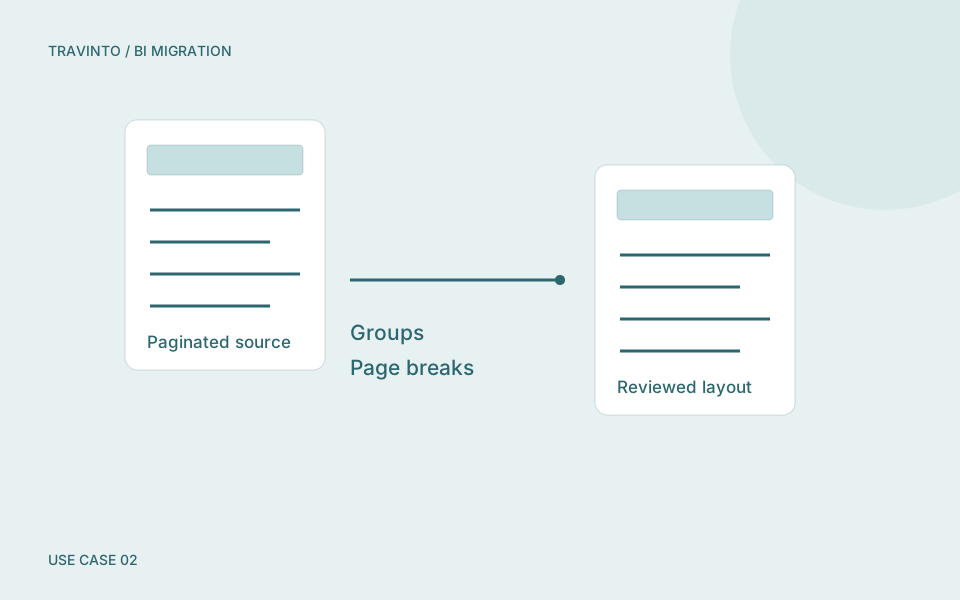
Preserve parameters, grouping, page layout requirements, exports, distribution, and access boundaries. Agree redesign where destination behavior differs.

Semantic, cube & spreadsheet renewal

Tabular, multidimensional, universe and workbook models

Define metric ownership, grain, hierarchies, calculation precedence, time intelligence, and security. Consolidate shared definitions before accepting target reports.

BI SOURCE & ARTIFACT CATALOG

100 starting points.
Find your reporting estate.

Explore BI platforms, legacy components, operational reporting, and native model or report artifacts. Search by name and filter by category to identify the right assessment scope.

20Enterprise & legacy BI20Self-service, Microsoft & visual analytics20Cloud, embedded & open analytics20Report, calculation & model artifacts20Operational, financial & application reporting

100 of 100 sources

  • SAP BusinessObjects Web IntelligenceEnterprise & legacy BI
  • SAP Crystal ReportsEnterprise & legacy BI
  • SAP LumiraEnterprise & legacy BI
  • SAP Design StudioEnterprise & legacy BI
  • SAP Analytics CloudEnterprise & legacy BI
  • SAP BW BEx queriesEnterprise & legacy BI
  • SAP Business Planning and ConsolidationEnterprise & legacy BI
  • IBM Cognos AnalyticsEnterprise & legacy BI
  • Cognos Report StudioEnterprise & legacy BI
  • Cognos Query StudioEnterprise & legacy BI
  • Cognos Analysis StudioEnterprise & legacy BI
  • Cognos TransformerEnterprise & legacy BI
  • IBM Cognos TM1Enterprise & legacy BI
  • MicroStrategyEnterprise & legacy BI
  • Oracle BI Enterprise EditionEnterprise & legacy BI
  • Oracle Analytics ServerEnterprise & legacy BI
  • Oracle Analytics CloudEnterprise & legacy BI
  • Oracle BI PublisherEnterprise & legacy BI
  • Oracle DiscovererEnterprise & legacy BI
  • Oracle Hyperion Interactive ReportingEnterprise & legacy BI
  • Microsoft Power BISelf-service, Microsoft & visual analytics
  • Power BI Report ServerSelf-service, Microsoft & visual analytics
  • SQL Server Reporting ServicesSelf-service, Microsoft & visual analytics
  • Analysis Services TabularSelf-service, Microsoft & visual analytics
  • Analysis Services MultidimensionalSelf-service, Microsoft & visual analytics
  • Excel Power PivotSelf-service, Microsoft & visual analytics
  • Excel Power QuerySelf-service, Microsoft & visual analytics
  • Excel PivotTablesSelf-service, Microsoft & visual analytics
  • Tableau DesktopSelf-service, Microsoft & visual analytics
  • Tableau ServerSelf-service, Microsoft & visual analytics
  • Tableau CloudSelf-service, Microsoft & visual analytics
  • Tableau PrepSelf-service, Microsoft & visual analytics
  • QlikViewSelf-service, Microsoft & visual analytics
  • Qlik SenseSelf-service, Microsoft & visual analytics
  • Qlik NPrintingSelf-service, Microsoft & visual analytics
  • TIBCO SpotfireSelf-service, Microsoft & visual analytics
  • SAS Visual AnalyticsSelf-service, Microsoft & visual analytics
  • SAS Enterprise GuideSelf-service, Microsoft & visual analytics
  • SAS Web Report StudioSelf-service, Microsoft & visual analytics
  • SAS Information Delivery PortalSelf-service, Microsoft & visual analytics
  • LookerCloud, embedded & open analytics
  • Looker StudioCloud, embedded & open analytics
  • Amazon QuickSightCloud, embedded & open analytics
  • Apache SupersetCloud, embedded & open analytics
  • MetabaseCloud, embedded & open analytics
  • RedashCloud, embedded & open analytics
  • LightdashCloud, embedded & open analytics
  • ModeCloud, embedded & open analytics
  • Sigma ComputingCloud, embedded & open analytics
  • ThoughtSpotCloud, embedded & open analytics
  • DomoCloud, embedded & open analytics
  • SisenseCloud, embedded & open analytics
  • GoodDataCloud, embedded & open analytics
  • Pentaho Business AnalyticsCloud, embedded & open analytics
  • JasperReportsCloud, embedded & open analytics
  • Jaspersoft ServerCloud, embedded & open analytics
  • Eclipse BIRTCloud, embedded & open analytics
  • KNIME Analytics PlatformCloud, embedded & open analytics
  • Alteryx DesignerCloud, embedded & open analytics
  • Zoho AnalyticsCloud, embedded & open analytics
  • DAX measuresReport, calculation & model artifacts
  • Power Query M queriesReport, calculation & model artifacts
  • MDX calculationsReport, calculation & model artifacts
  • Tabular model definitionsReport, calculation & model artifacts
  • SSRS RDL reportsReport, calculation & model artifacts
  • Power BI PBIX workbooksReport, calculation & model artifacts
  • Power BI PBIP projectsReport, calculation & model artifacts
  • TMDL model definitionsReport, calculation & model artifacts
  • Tableau TWB workbooksReport, calculation & model artifacts
  • Tableau TWBX packagesReport, calculation & model artifacts
  • Tableau Hyper extractsReport, calculation & model artifacts
  • Tableau level-of-detail expressionsReport, calculation & model artifacts
  • Qlik load scriptsReport, calculation & model artifacts
  • Qlik set-analysis expressionsReport, calculation & model artifacts
  • BusinessObjects UNV universesReport, calculation & model artifacts
  • BusinessObjects UNX universesReport, calculation & model artifacts
  • Cognos Framework Manager modelsReport, calculation & model artifacts
  • Cognos report XML specificationsReport, calculation & model artifacts
  • LookML modelsReport, calculation & model artifacts
  • Looker derived-table definitionsReport, calculation & model artifacts
  • Oracle Essbase cubesOperational, financial & application reporting
  • Oracle Planning formsOperational, financial & application reporting
  • Oracle Financial ReportingOperational, financial & application reporting
  • Oracle ReportsOperational, financial & application reporting
  • Oracle APEX reportsOperational, financial & application reporting
  • PeopleSoft nVisionOperational, financial & application reporting
  • JD Edwards EnterpriseOne reportsOperational, financial & application reporting
  • SAP ABAP ALV reportsOperational, financial & application reporting
  • SAP Smart FormsOperational, financial & application reporting
  • SAP Business One Crystal reportsOperational, financial & application reporting
  • Infor BirstOperational, financial & application reporting
  • Infor SunSystems Q&AOperational, financial & application reporting
  • IBM Db2 Web QueryOperational, financial & application reporting
  • Jaspersoft Ad Hoc viewsOperational, financial & application reporting
  • WebFOCUSOperational, financial & application reporting
  • OpenText Actuate iHubOperational, financial & application reporting
  • OpenText Magellan BI & ReportingOperational, financial & application reporting
  • Yellowfin BIOperational, financial & application reporting
  • BoardOperational, financial & application reporting
  • JedoxOperational, financial & application reporting

The catalog describes source assessment coverage, including products, components, and artifact families. Confirm version compatibility, licensed access, export formats, supported conversion patterns, and target capabilities for each migration.

Source artifacts and access to agree

Enterprise & legacy BI

Approved report, universe, repository, cube, or semantic-model exports; versions, security definitions, and dependencies.

Self-service, Microsoft & visual analytics

Permitted workbooks, model definitions, report packages, calculations, refresh settings, permissions, and usage context.

Cloud, embedded & open analytics

Authorized semantic definitions, report specifications, dashboard metadata, SQL, embeds, identity settings, and delivery requirements.

Report, calculation & model artifacts

Native artifacts are assessed in their own right. Packaging, extract contents, custom extensions, encryption, and export permissions affect what can be inspected.

Operational, financial & application reporting

Approved reporting definitions, financial hierarchies, templates, query logic, application context, scheduling, and access policies.

PRODUCT FEATURES & DELIVERY SCOPE

More than report conversion.
A governed migration workflow.

Scope the inventory, semantic design, conversion proposals, validation, and release controls together. Product availability, integrations, and supported patterns are confirmed during assessment.

01Report estate inventory

Scope reports, dashboards, datasets, universes, cubes, semantic models, schedules, and subscriptions. Capture ownership, version, usage evidence, and criticality before deciding what to retain.

02Dependency & lineage analysis

Trace measures, dimensions, source queries, shared datasets, transformation logic, and downstream consumption. Keep unresolved dynamic queries and application dependencies visible.

03Semantic-model mapping

Map business entities, relationships, grain, aggregation behavior, hierarchies, and shared definitions to a reviewed target design. A matching field name does not establish equivalent meaning.

04Calculation conversion proposals

Apply approved mappings to supported expressions and prepare agent-assisted alternatives for ambiguous logic. Review DAX, MDX, M, SQL, set analysis, and platform-specific semantics separately.

05Filters & interaction review

Assess slicers, prompts, parameters, drill paths, cross-filter behavior, bookmarks, and report context. Test calculations under representative combinations of user selections.

06Security & identity mapping

Map authorized roles, row-level or object-level restrictions, workspace permissions, and embedded identities. Validate allowed and denied cases with approved test users.

07Visual & paginated redesign

Assess chart intent, conditional formatting, grouping, pagination, exports, printing, and accessibility. Unsupported visuals and custom extensions require explicit redesign decisions.

08Refresh & delivery planning

Scope gateways, credentials, refresh dependencies, source availability, subscriptions, bursting, and delivery timing. Confirm destination features and operating ownership before rollout.

09Report rationalization

Identify overlapping measures, repeated datasets, unused assets, and candidates for consolidation. Business owners decide which assets are retired, merged, rebuilt, or migrated.

10Parity test preparation

Prepare expected results by metric, reporting period, filter context, currency, totals, and user role. Document tolerances and investigate differences rather than assuming visual similarity proves parity.

11Reviewable migration packages

Scope inventory findings, target-model proposals, calculation mappings, report-design decisions, exception registers, and test evidence. Confirm repository and deployment integration for the implementation.

12Release & adoption controls

Define pilot users, parallel-run periods, review ownership, training, go/no-go evidence, rollback, and retirement criteria. This website does not run migrations or connect to BI platforms.
BI MIGRATION LIFECYCLE
  1. Inventory & prioritize
  2. Define semantic intent
  3. Map & redesign
  4. Build target proposals
  5. Validate parity
  6. Review & adopt

Carry metric definitions, filter behavior, identity, and source evidence through each stage. Retire an old report only after its replacement and operating responsibilities are accepted.

TWO APPROACHES / ONE ACCEPTANCE STANDARD

Rules for repeatability.
Agents for assisted reasoning.

Select the approach by task. Known transformations and policy checks suit explicit rules; incomplete context and complex exceptions may benefit from agent assistance.

RULES & CONTROLLED EXECUTION

Deterministic solution

  1. Inventory report objects and map supported measures, dimensions, filters, and visual properties.
  2. Apply approved calculation conversions and permission mappings with explicit exceptions.
  3. Run parity checks across selected periods, filters, totals, and authorized user roles.

CONTEXT & REVIEWABLE PROPOSALS

Agentic solution

  1. Explain legacy calculation logic using approved semantic definitions and report dependencies.
  2. Propose target measures or visual designs when direct feature mapping is unavailable.
  3. Identify redundant reports and prepare rationalization options for business owners.
Decision and execution boundary

Visual similarity does not establish metric parity. Converted measures, filter behavior, and access rules require repeatable tests and business sign-off regardless of how they were prepared.

From approved inputs
to an accepted outcome.

X2X BI Migrator / shared execution model
01

Approved context

Versioned inputs, identity, scope

02

Rules or agent assistance

Explicit mappings or reviewed proposals

03

Independent checks

Tests, reconciliation, exception evidence

04

Accountable decision

Accept, revise, reject, or escalate

Use representative cases to establish an acceptance baseline. Record input versions, rule or model configuration, failed checks, reviewer decisions, and recovery requirements.

ACCEPTANCE / BUSINESS & TECHNICAL EVIDENCE

Looks familiar.
Now prove the behavior.

Use a shared semantic specification for measures, grain, calendars, currencies, and access rules. Treat differences as owned exceptions until the appropriate reviewers accept them.

Metric parity

Compare agreed measures, totals, subtotals, nulls, and rounding at the correct grain.

Filter behavior

Test selected dates, slicers, prompts, drill paths, and cross-filter interactions.

Time & currency

Check fiscal calendars, effective dates, time zones, conversion rules, and period boundaries.

Security parity

Test representative identities, permitted rows, denied records, and export access.

Presentation & delivery

Review accessibility, pagination, printing, exports, subscriptions, and refresh dependencies.

Business acceptance

Record owners, evidence, exceptions, approved tolerances, parallel-run findings, and release decisions.

X2X BI MIGRATOR / 10 USE CASES

Find your requirement.
Understand the work.

Explore ten scenarios specific to X2X BI Migrator. Explore a case-study card to see the business challenge, deterministic work, agentic assistance, and acceptance evidence to scope for your estate.

Enterprise dashboard platform migration: A business team needs dashboards recreated on a different BI platform with consistent decisions and definitions.01DASHBOARDSIndustryRetail & commerceExample marketUnited StatesEnterprise dashboard platform migrationA business team needs dashboards recreated on a different BI platform with consistent decisions and definitions.Explore case study

DELIVERY APPROACH & ACCEPTANCE

Deterministic work
Map supported measures, dimensions, filters, and visual properties against an approved target specification.
Agentic assistance
Explain unsupported calculations and propose redesign options with assumptions made visible.
Acceptance evidence
Compare metric values, drill paths, interactions, access rules, and representative user tasks.
Discuss this use case ↗
Paginated and operational report renewal: A report estate depends on printable documents, parameters, grouping, and recurring distribution.02OPERATIONAL REPORTINGIndustryPublic sectorExample marketUnited KingdomPaginated and operational report renewalA report estate depends on printable documents, parameters, grouping, and recurring distribution.Explore case study

DELIVERY APPROACH & ACCEPTANCE

Deterministic work
Map approved query, parameter, grouping, pagination, and delivery requirements.
Agentic assistance
Suggest layout or expression alternatives where destination features differ.
Acceptance evidence
Review page breaks, totals, exports, printing, recipient access, and scheduled-delivery behavior.
Discuss this use case ↗
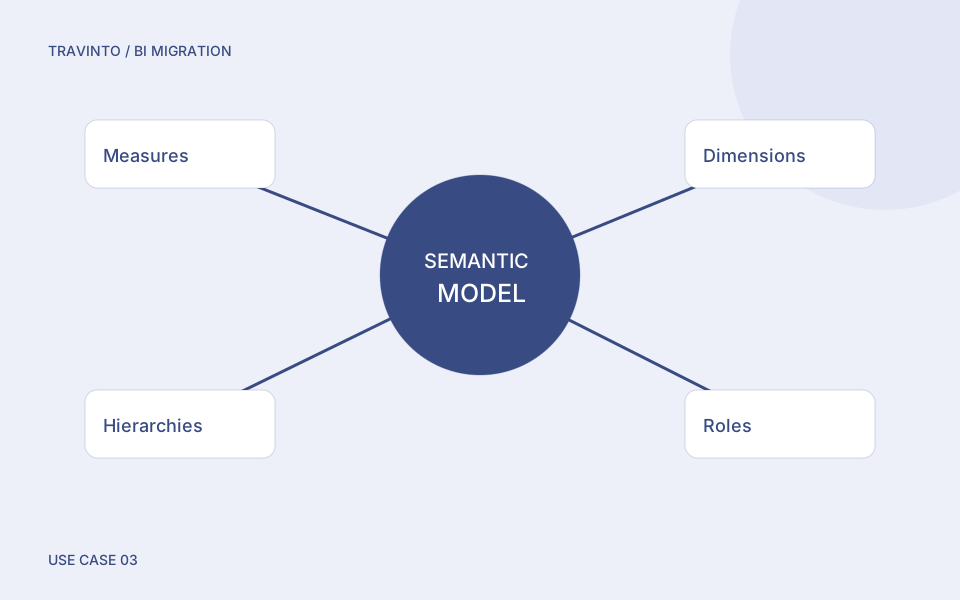
Cube and semantic-model migration: Business logic is concentrated in cubes, universes, tabular models, or shared reporting layers.03SEMANTIC MODELSIndustryManufacturingExample marketGermanyCube and semantic-model migrationBusiness logic is concentrated in cubes, universes, tabular models, or shared reporting layers.Explore case study

DELIVERY APPROACH & ACCEPTANCE

Deterministic work
Map owned entities, relationships, hierarchies, aggregation rules, and supported calculations.
Agentic assistance
Explain calculation dependencies and propose target semantic structures for review.
Acceptance evidence
Test grain, filter propagation, hierarchy behavior, calculation precedence, and governed definitions.
Discuss this use case ↗
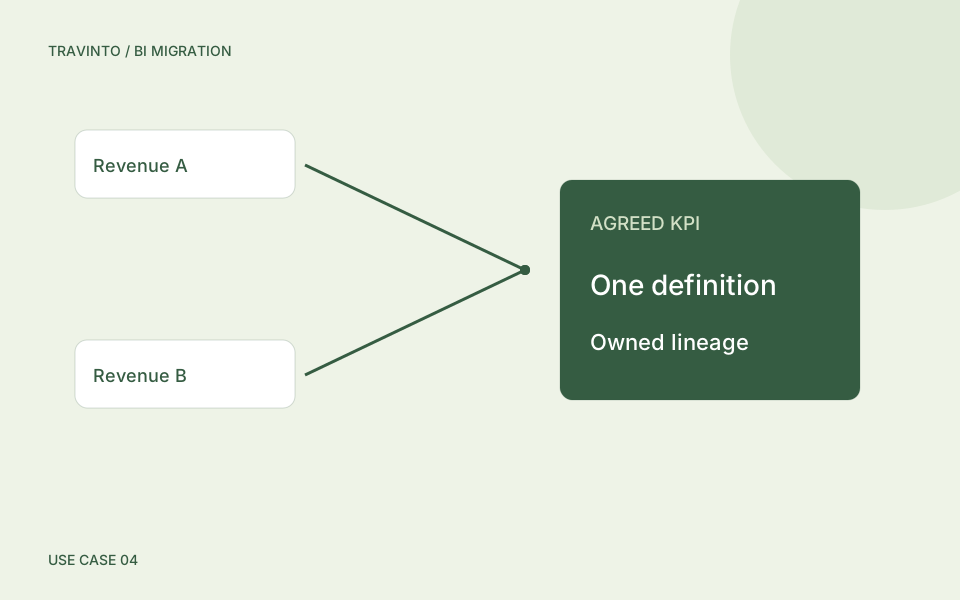
Executive KPI consolidation: Leadership dashboards use conflicting definitions of the same named business measure.04METRIC CONSISTENCYIndustryProfessional servicesExample marketUnited Arab EmiratesExecutive KPI consolidationLeadership dashboards use conflicting definitions of the same named business measure.Explore case study

DELIVERY APPROACH & ACCEPTANCE

Deterministic work
Inventory definitions, source lineage, reporting periods, ownership, and approved metric contracts.
Agentic assistance
Explain differences and propose consolidation options without choosing business policy.
Acceptance evidence
Obtain owner approval of definitions and verify reconciled measures across the retained reports.
Discuss this use case ↗
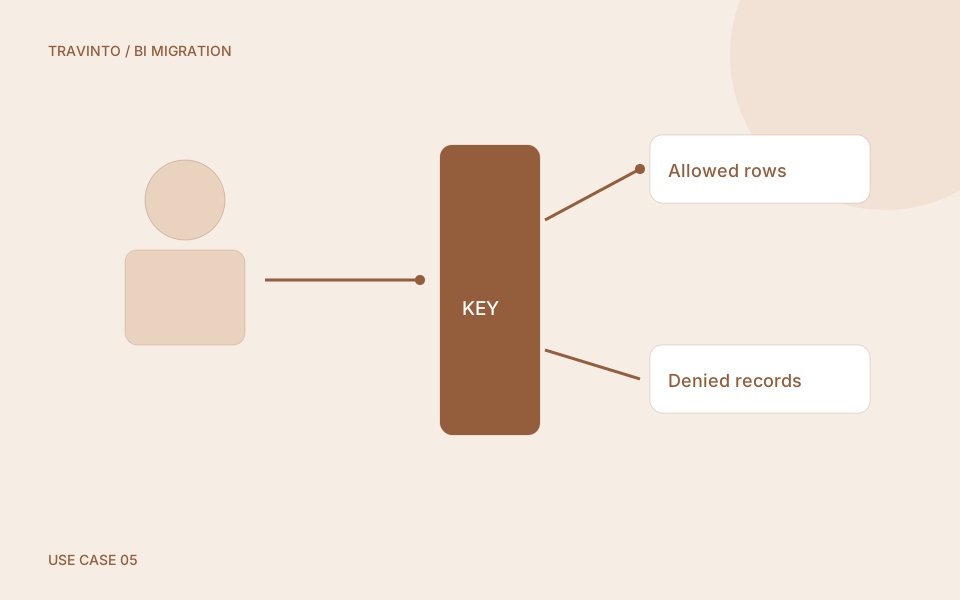
Role-based reporting migration: A target BI environment must preserve which users can view, export, or share specific information.05SECURITY PARITYIndustryBanking & financial servicesExample marketSingaporeRole-based reporting migrationA target BI environment must preserve which users can view, export, or share specific information.Explore case study

DELIVERY APPROACH & ACCEPTANCE

Deterministic work
Map approved roles, user attributes, row or object restrictions, and destination permission settings.
Agentic assistance
Identify policy conflicts and prepare test scenarios for representative identities.
Acceptance evidence
Verify allowed and denied rows, sensitive measures, exports, embedded access, and sharing paths.
Discuss this use case ↗
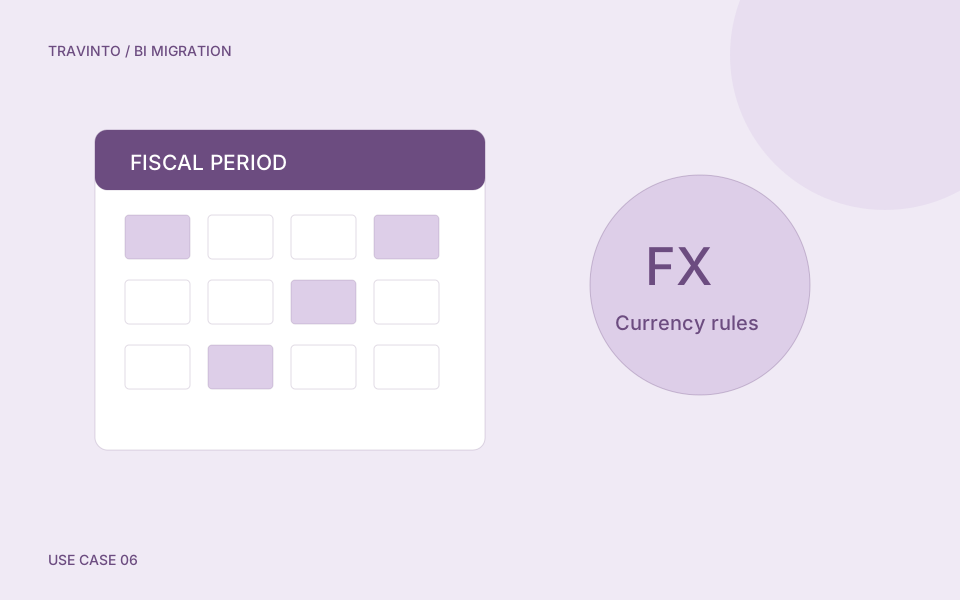
Financial period and currency reporting: Reports must preserve fiscal calendars, conversion policies, closing periods, and comparative measures.06FINANCIAL SEMANTICSIndustryInsuranceExample marketIndiaFinancial period and currency reportingReports must preserve fiscal calendars, conversion policies, closing periods, and comparative measures.Explore case study

DELIVERY APPROACH & ACCEPTANCE

Deterministic work
Apply agreed calendar, currency, rounding, and time-intelligence mappings to supported expressions.
Agentic assistance
Explain legacy calculation intent and flag ambiguous period or exchange-rate assumptions.
Acceptance evidence
Compare period boundaries, year-to-date measures, subtotals, currencies, and approved finance examples.
Discuss this use case ↗
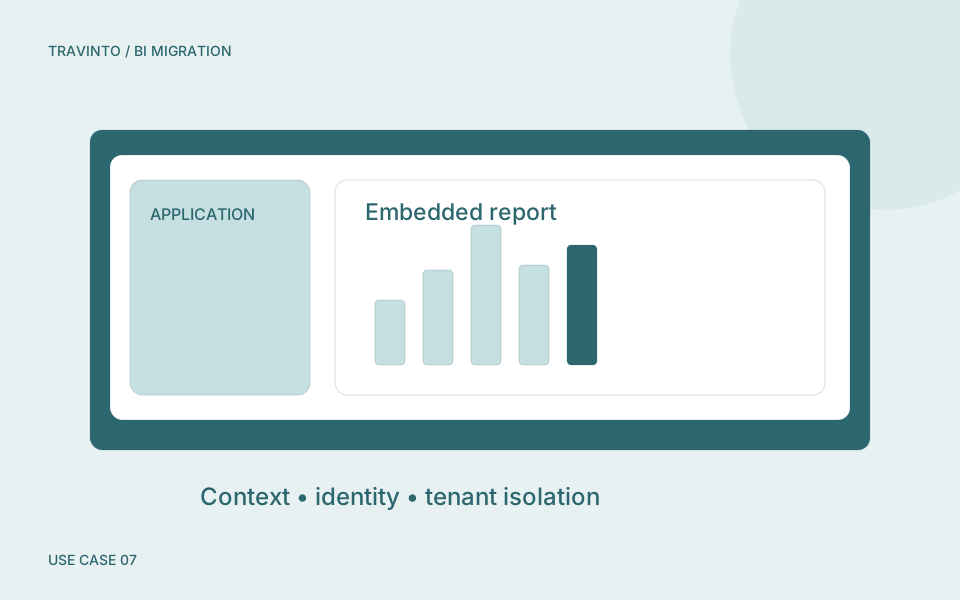
Embedded analytics modernization: A customer-facing or internal application embeds reports with contextual filters and application identity.07APPLICATION ANALYTICSIndustryTelecommunicationsExample marketNetherlandsEmbedded analytics modernizationA customer-facing or internal application embeds reports with contextual filters and application identity.Explore case study

DELIVERY APPROACH & ACCEPTANCE

Deterministic work
Map approved report parameters, embed contracts, context passing, and authorization requirements.
Agentic assistance
Propose replacements for unsupported interactions or integration patterns.
Acceptance evidence
Test tenant isolation, application roles, filter injection boundaries, navigation, accessibility, and user journeys.
Discuss this use case ↗
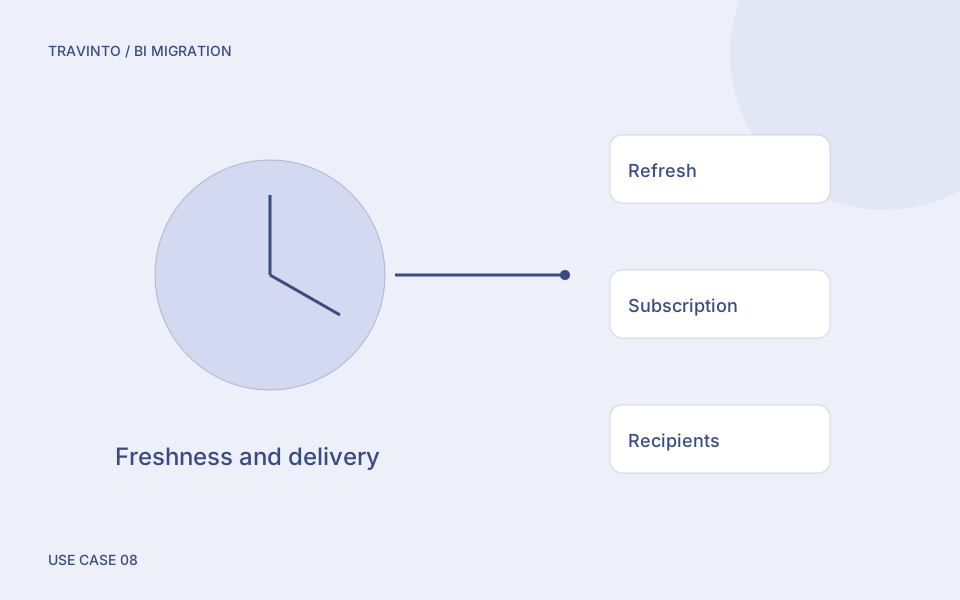
Refresh and subscription transition: Users rely on refresh windows, extracts, gateways, subscriptions, or burst reporting.08DELIVERY OPERATIONSIndustryLogisticsExample marketAustraliaRefresh and subscription transitionUsers rely on refresh windows, extracts, gateways, subscriptions, or burst reporting.Explore case study

DELIVERY APPROACH & ACCEPTANCE

Deterministic work
Map dependencies, refresh schedules, permitted connections, recipient rules, and failure notifications.
Agentic assistance
Analyze operational gaps and propose delivery or recovery plans for review.
Acceptance evidence
Rehearse data freshness, credential handling, refresh failures, time zones, recipients, and escalation.
Discuss this use case ↗
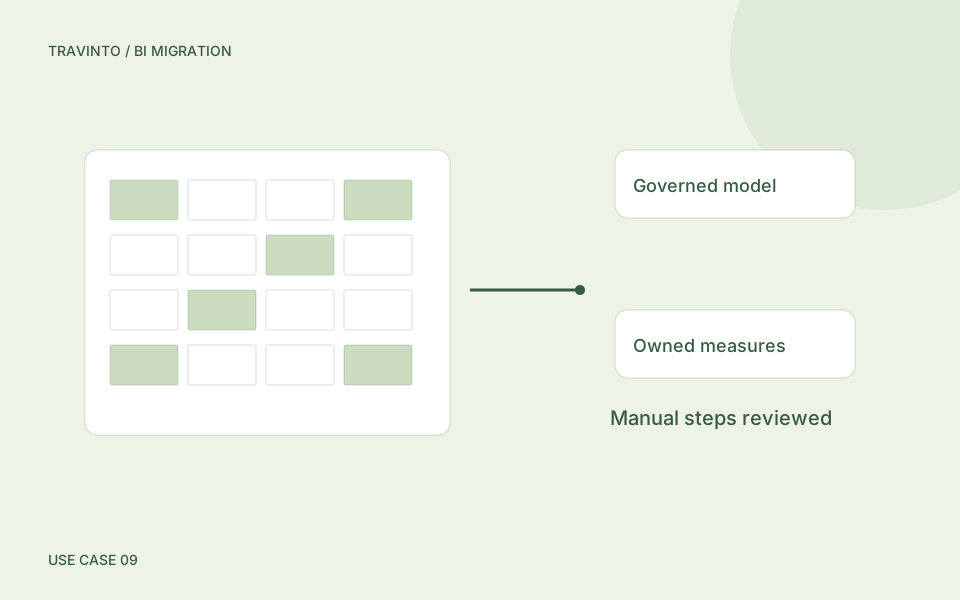
Spreadsheet-led reporting migration: Critical reporting depends on workbook formulas, pivot logic, manual steps, and undocumented data preparation.09SELF-SERVICE GOVERNANCEIndustryEducationExample marketCanadaSpreadsheet-led reporting migrationCritical reporting depends on workbook formulas, pivot logic, manual steps, and undocumented data preparation.Explore case study

DELIVERY APPROACH & ACCEPTANCE

Deterministic work
Inventory permitted queries, measures, transformations, manual inputs, and refresh dependencies.
Agentic assistance
Explain workbook logic and propose governed model and report designs with ownership gaps highlighted.
Acceptance evidence
Compare accepted workbook examples, manual adjustments, refresh behavior, metric definitions, and user access.
Discuss this use case ↗
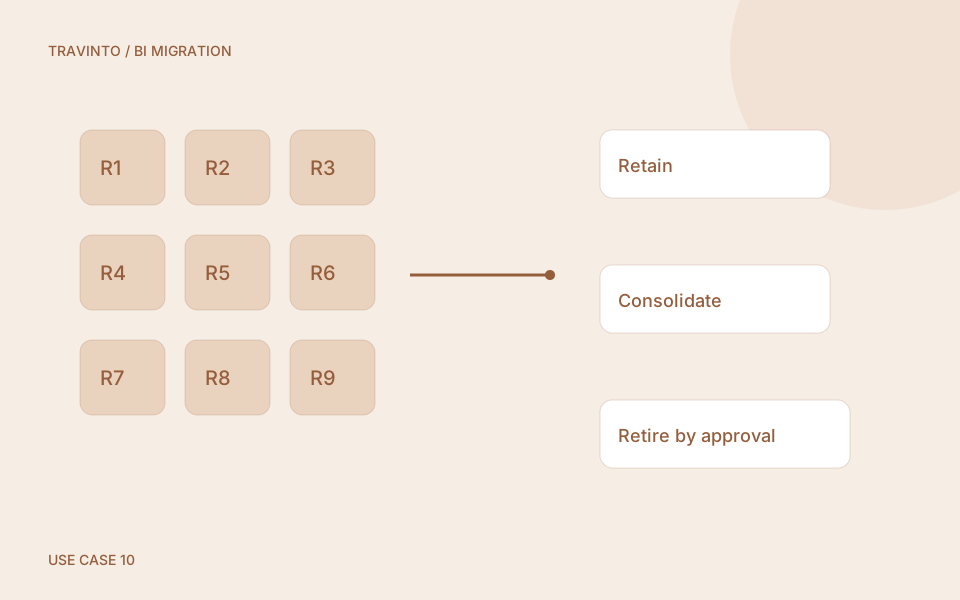
Report estate rationalization: A migration program must decide which reports to move, redesign, consolidate, or retire.10PORTFOLIO REDUCTIONIndustryHealthcareExample marketUnited KingdomReport estate rationalizationA migration program must decide which reports to move, redesign, consolidate, or retire.Explore case study

DELIVERY APPROACH & ACCEPTANCE

Deterministic work
Combine approved inventory, usage evidence, dependency information, and business ownership criteria.
Agentic assistance
Suggest overlap clusters and prepare disposition options for accountable stakeholders.
Acceptance evidence
Confirm consumer needs, definition coverage, retained dependencies, retirement approvals, and replacement adoption.
Discuss this use case ↗

Industry and example-market labels provide scenario context. They do not identify actual customers or customer locations. These use cases describe requirements and design approaches, not completed customer projects. Source and target compatibility, available features, and implementation scope are confirmed during assessment.

PRODUCT QUESTIONS

Plan with clarity.

Does BI migration mean copying every existing dashboard?

No. Review usage, duplicated reporting, metric ownership, and decision needs before selecting what to retain, consolidate, redesign, or retire. Target features and calculation behavior require separate validation.

What information is needed to assess product fit?

Start with a bounded workflow, authorized source examples, platform versions, business rules, and named reviewers. Agree the expected evidence and acceptance criteria before implementation.

How can we discuss availability and implementation?

Contact Travinto with the source and target landscape, scope, and operating constraints. Availability, integrations, execution capabilities, delivery responsibilities, and commercial terms require confirmation.

Does the catalog contain 100 different BI products?

It contains 100 named source entries: BI products, legacy product components, application-reporting sources, and native report or model artifact families. These are distinct assessment entries, not a claim of 100 independent vendors or certified automatic converters. Versions, export permissions, source formats, custom extensions, and target routes require confirmation.

What does BI migration include beyond report conversion?

BI migration also includes semantic models, calculation behavior, filter context, security, refresh, delivery, accessibility, and business adoption. Some assets can be mapped, some need redesign, and others may be retired after owner review. Data and code modernization can be coordinated as separate workstreams.

Can a migrated dashboard be accepted from screenshots alone?

No. Screenshots can support a visual review, but acceptance also requires metric, filter, time, currency, security, refresh, and delivery checks using representative cases. Agree expected results and tolerances with business owners.

What should we provide for a BI migration assessment?

Provide permitted native exports, platform versions, data-source dependencies, model and calculation definitions, role mappings, delivery requirements, usage information where available, and representative acceptance examples. Packaged workbooks and extracts may contain sensitive data; agree the permitted inspection scope and remove credentials before sharing.

Product scope and availability are confirmed during assessment. This website does not execute migrations, data pipelines, or operational actions.

Compare Travinto products